And what they mean for solar energy in Central America…
It has been too long since we posted anything meaty here. Apologies but it has been a very busy time at Avolta. I will post something on all the progress we have made during this busy time, but wanted to get blogging again and the Intergovernmental Panel on Climate Change report from last month provided a great reminder as to why we do what we do at Avolta.
It is no exaggeration to call this the most important chart in the world – where global temperatures go over the next 50-100 years is likely to be the biggest driver of basically everything; economics, politics, public health, immigration.
The Most Important Chart In The World
Chart 1. The Terrifying One: Change in Average Global Temperatures Relative to 1850-1900 – observed and simulated temperatures.
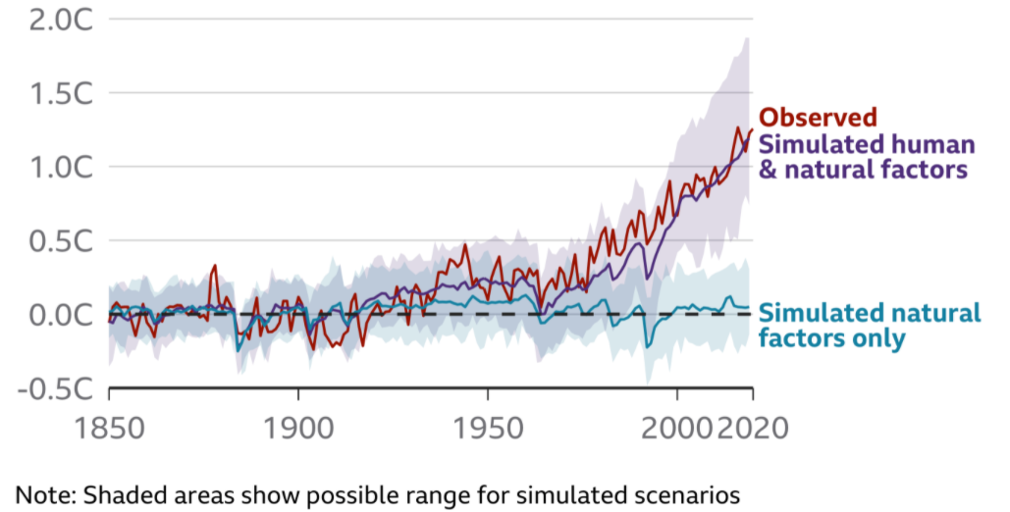
Global temperatures are rising and are already over 1 degree above temperatures seen in 1850-1900
There was a notable change of tone from the IPCC this time around. According to the IPCC report, global greenhouse gas emissions are changing the Earth’s climate. This year, for the first time ever, the draft of the report stated that human influence is “extremely likely” (99 percent) to be the main driver of global warming since 1950. The report also listed some other effects of increased carbon dioxide in our atmosphere: These changes are occurring across all continents and oceans.
Key points from the IPCC report:
Global surface temperature was >1C higher in the decade between 2011-2020 than between 1850-1900.
The past five years have been the hottest on record since 1850
The rate of sea level rise has nearly tripled compared with 1901-1971
Human influence is “very likely” (90%) the main driver of the global retreat of glaciers since the 1990s and the decrease in Arctic sea-ice
It is “virtually certain” that hot extremes including heatwaves have become more frequent and more intense since the 1950s, while cold events have become less frequent and less severe
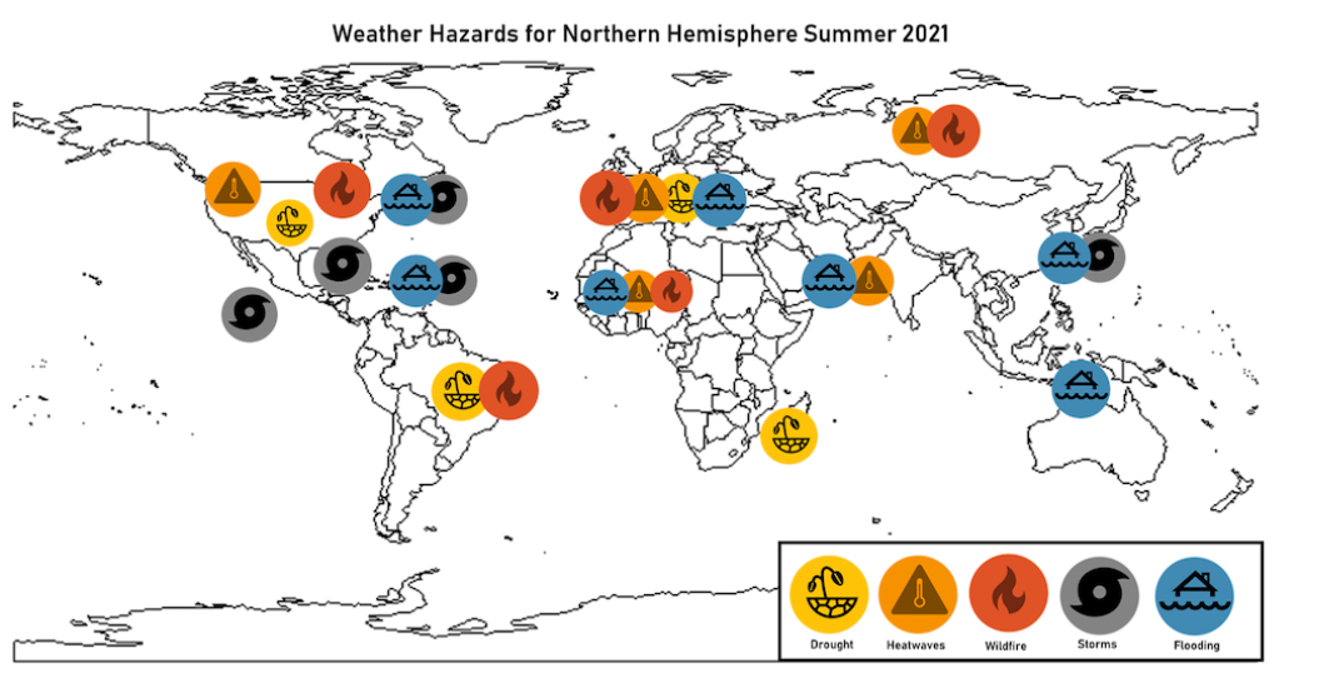
The fact that the report was published while there were wildfires in Algeria, Greece, California, Siberia and Oregon, and horrific floods in China, Germany, Spain and New York – really brings home that the impacts of climate change are here and now.Carbonbrief has an excellent and comprehensive and profoundly upsetting list of the extreme weather events this year.
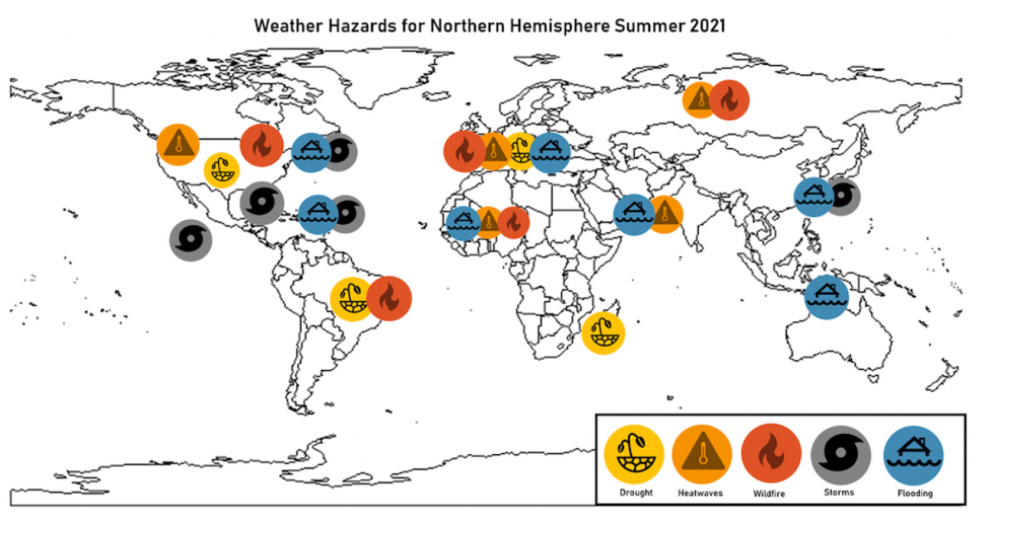
Weird weather events are happening all over the world this year
The IPCC report touches on tipping points in the climate system, such as the shutdown of the Gulf Stream and collapse of part of the Antarctic Ice Sheet, categorizing them as low-risk but high-impact events.
Chart 2: Moore’s Law
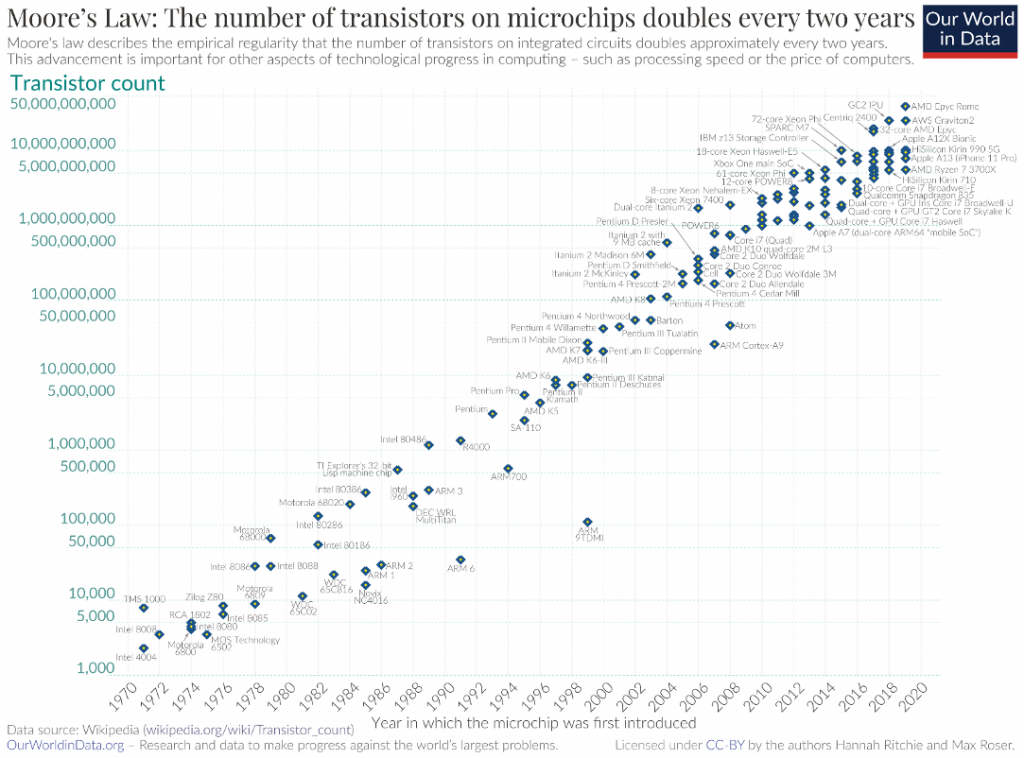
Moore’s law – that the number of transistors on a microchip doubles every two years, while the cost of computers continues to fall – underpins most other technological progress now: from the amazing fall in costs for sequencing the human genome, to the now rapid spread of artificial intelligence and machine learning across so many fields including energy. This is all happening because computers just get more powerful every year.
Because Moore’s law has so many spillover effects, the fact that we have seen a slow down in annual improvements of CPU performance, from the roughly 40% p.a. needed for Moore’s law to hold, to closer to 30% in recent years, has generated plenty of concerned headlines, but looking at total system on a chip performance shows an explosion in recent years, with Apple’s total system on a chip performance surging by over 100% p.a. since 2015.
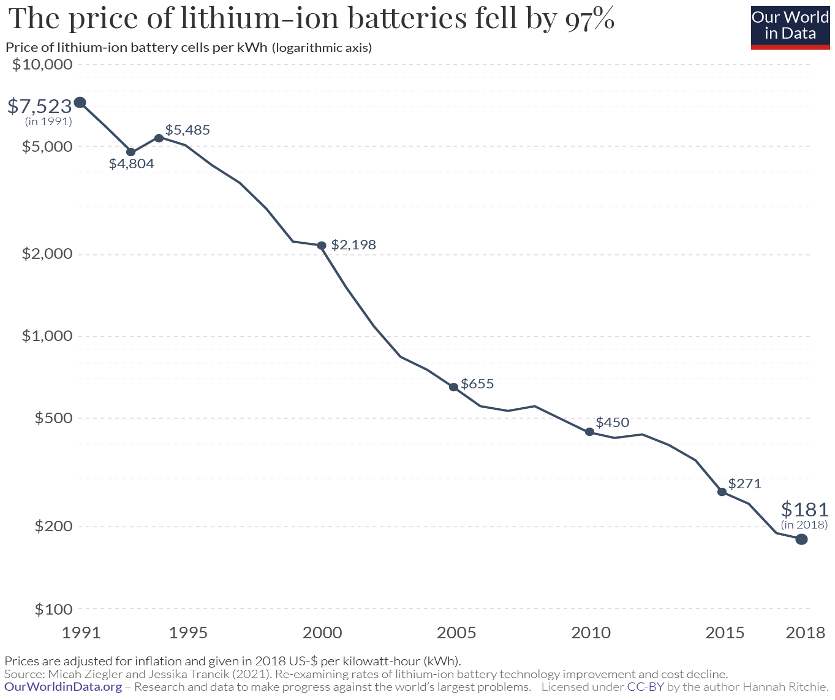
The Optimistic Charts – PV and Battery Prices Fall massively and Installations Are Surging
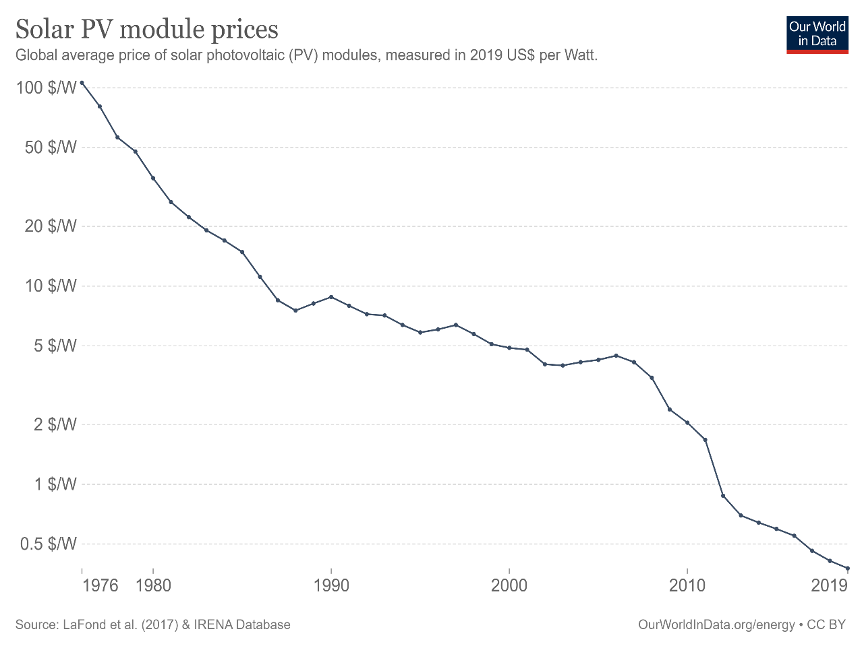
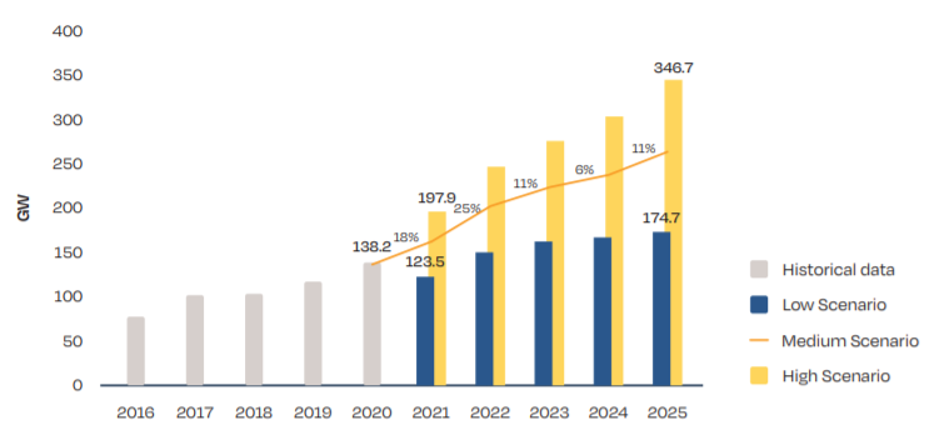
Annual Solar PV Installations Surging
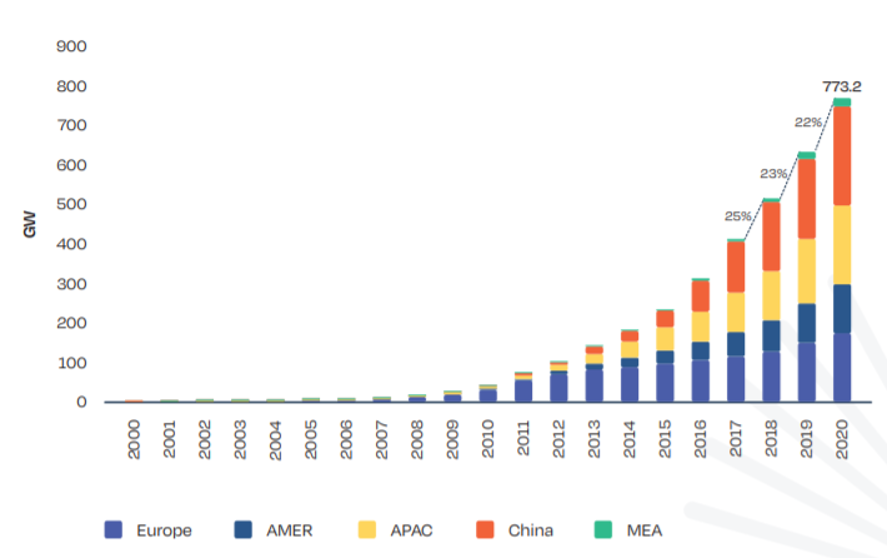
These are the charts that just might save us all. We have seen the prices of renewable energy collapse over the past two decades, for reasons we have gone into at length in some previous blog posts. And now we are seeing extraordinary growth in solar installations around the world.
Solar is the cheapest form of energy in many parts of the world and this is driving this tectonic shift away from fossil fuels and into renewables.
The IPCC report makes it clear however, that even the optimistic/high scenarios for PV growth is not enough to prevent ongoing global temperature rises.
What This Means For Solar In Central America
As we have written in previous posts, PV and battery prices have stopped falling for now. The surge in demand and the chaos that Covid-19 has inflicted on global supply chains has pushed prices up by around 20%.
The huge shift that we are seeing in electric vehicle production has strained lithium ion battery availbility, such that there are almost no C&I batteries available for Latin America this year.
President Biden is proposing a 10x growth in US solar power by 2050 – with solar providing 50% of US electricity – this would clearly translate into much higher demand, which the industry can meet but it is clearly bullish on the margin for PV prices.
The key takeaway for Central America is that now is the time to go solar, prices are flatlining or even going up – so the argument that you should wait because prices keep falling is no longer true.